SPLAT! installation and LOS analysis
SPLAT! for RF Coverage
SPLAT! open-source software that can be used to analyze a radio link between two locations and to generate coverage maps of RF transmitters. The Coverage maps, path loss and field strength are calculated using Longley-Rice Irregular Terrain as well as the new Irregular Terrain with Obstruction model. SPLAT! can predict RF coverage for any frequencies between 20 MHz and 20 GHz. It is thus useful for ham radio, broadcast radio, terrestrial television and wireless networks.
SPLAT! uses data from SRTM elevation files. This document will provide a basics of SPLAT! from installation to usage.

Install on Linux
Installation of SPLAT! on linux is quite easy. You will find SPLAT! in the repositories and you can install in Linux Ubuntu:
sudo apt install splat
The compilation from source does not need source code editing. Just download the source archive, extract it, open a terminal in that folder and run the commandds:
sudo apt install build-essential libbz2-dev
./configure
sudo ./install all
You will be prompted to select the maximum analysis region. That’s it. You should now be able to run splat and its utilities from terminal.
Documentation
The documentation of SPLAT! can be found in official SPLAT! website. The documentation describes usage of SPLAT! and has all the commands used with SPLAT!.
Elevation data
There are lots of sources you can get SRTM data from. It is comparatively easy to get data from the site viewfinderpanoramas.org. Simply click the regions you want and zip file will be downloaded with SRTM files for those regions. These files contains files with .hgt format. You need to convert these .hgt file to .sdf file for SPLAT!.
Make a folder named SPLAT in your directory. Copy the script given below in file hgt_to_sdf.sh. This script will convert SRTM .hgt files to .sdf files which SPLAT! can read.
#!/bin/bash
shopt -s nullglob
for f in /<path_to_srtm_folder>/*.hgt; do
    echo "Converting $f"
    srtm2sdf $f
done
Adjust the absolute path of .hgt files in
 chmod +x ./script.sh
 ./script.sh
At this point, you will have .sdf file generated.
## Using SPLAT! for analysis. For using SPLAT! you need input files. Mandatory files include digital elevation topography models in the form of SPLAT Data Files (SDF files), site location files(QTH files), and Irregular Terrain Model parameter files (LRP files).
Optional files include city locationfiles, cartographic boundary files, user-defined terrain files, path loss input files, antenna radiation patternfiles, and color definition files.
SPLAT! takes coordinates as degrees latitude West and degrees longitude North. i.e all the latitude in East should be -ve and longitude in the South should be -ve.
For demonstration let’s use a Romanian television transmitter with the following parameters.
- Location: 45° 25” 37.49 North / 25° 29” 06.0 East;
- Antenna height: 94 meters (at 2490 meters altitude);
- Frequency: 474 MHz and horizontal polarization;
- ERP: 150 kW;
For this two files with same name must be created.
tx1.qth
Site-1 ; write whatever name you want here
45 25 37.49
-25 29 06.0
94m
tx1.lrp
15.000 ; Earth Dielectric Constant (Relative permittivity)
0.005 ; Earth Conductivity (Siemens per meter)
301.000 ; Atmospheric Bending Constant (N-units)
474.000 ; Frequency in MHz (20 MHz to 20 GHz)
5 ; Radio Climate (5 = Continental Temperate)
0 ; Polarization (0 = Horizontal, 1 = Vertical)
0.50 ; Fraction of situations (50% of locations)
0.90 ; Fraction of time (90% of the time)
150000.0 ; Effective Radiated Power (ERP) in Watts (optional)
In the LRP file remember to adjust climate and terrain parameters if the case. The default will work for most situations. Adjust frequency, polarization and ERP. The statistical parameters play an important role (situations and time). For digital television in ATSC standard values 0.5 and 0.9 are recommended for situations, respectively time.
The same files are needed for the receiver site too. Here is an example:
home.qth
Home
44.791931
-27.483563
5m
home.lrp
15.000 ; Earth Dielectric Constant (Relative permittivity)
0.005 ; Earth Conductivity (Siemens per meter)
301.000 ; Atmospheric Bending Constant (N-units)
; Frequency in MHz (20 MHz to 20 GHz)
5 ; Radio Climate (5 = Continental Temperate)
0 ; Polarization (0 = Horizontal, 1 = Vertical)
0.50 ; Fraction of situations (50% of locations)
0.90 ; Fraction of time (90% of the time)
; Effective Radiated Power (ERP) in Watts (optional)
You can specify ERP and Frequency in the home.lrp too. After making these files, its time to run SPLAT!. Run SPLAT! using the following command.
splat -t <path_to_transmitter_qth> -r <path_to_receiver_qth> -metric -m 1.333 -d <path_to_sdf_files>
If you see a line like below (i.e assuming given region as sea-level), it means that the corresponding SDF file is missing.
- Region "45:46:332:333" assumed as sea-level into page x... Done!
If everything is OK, SPLAT! will load SDF files and you will see only lines like:
+ Loading "/path/to/sdf-sd/44:45:333:334.sdf" into page x... Done!
The result of running SPLAT! will be a text file named
Receiver site: Home
Distance to Site-1: 172.01 kilometers
Azimuth to Site-1: 294.95 degrees
Elevation angle to Site-1: +0.2659 degrees

Field strength at Home: 58.27 dBuV/meter
Signal power level at Home: -72.50 dBm
Signal power density at Home: -87.51 dBW per square meter
Voltage across a 50 ohm dipole at Home: 67.83 uV (36.63 dBuV)
Voltage across a 75 ohm dipole at Home: 83.07 uV (38.39 dBuV)
Mode of propagation: Line of Sight
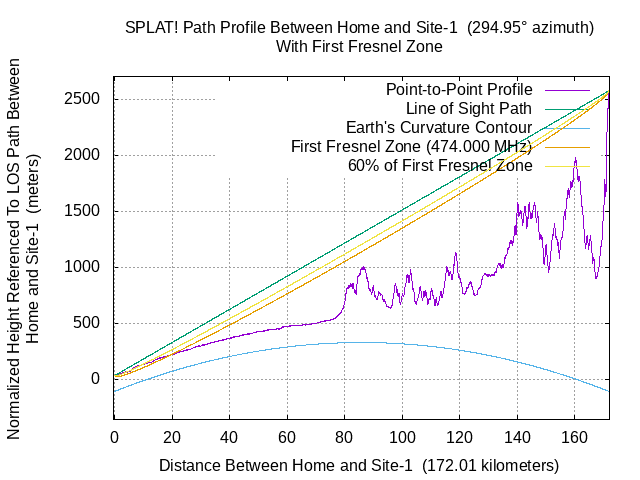
you may be interested in a height profile map. For this you have to run the following command.
splat -t <path_to_transmitter_qth> -r <path_to_receiver_qth> -metric -m 1.333 -d <path_to_sdf_files> -H linkmap.png
you will see linkmap.png in your folder.

you may be interested in coverage for your transmitter. For this you have to run the following command.
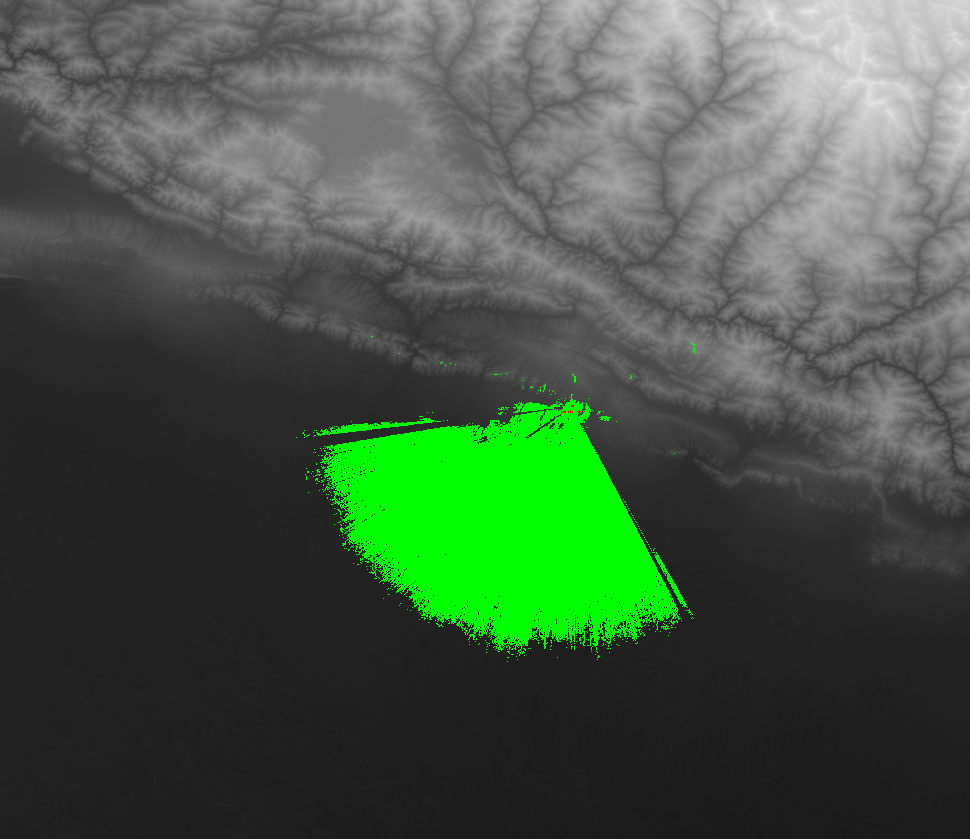
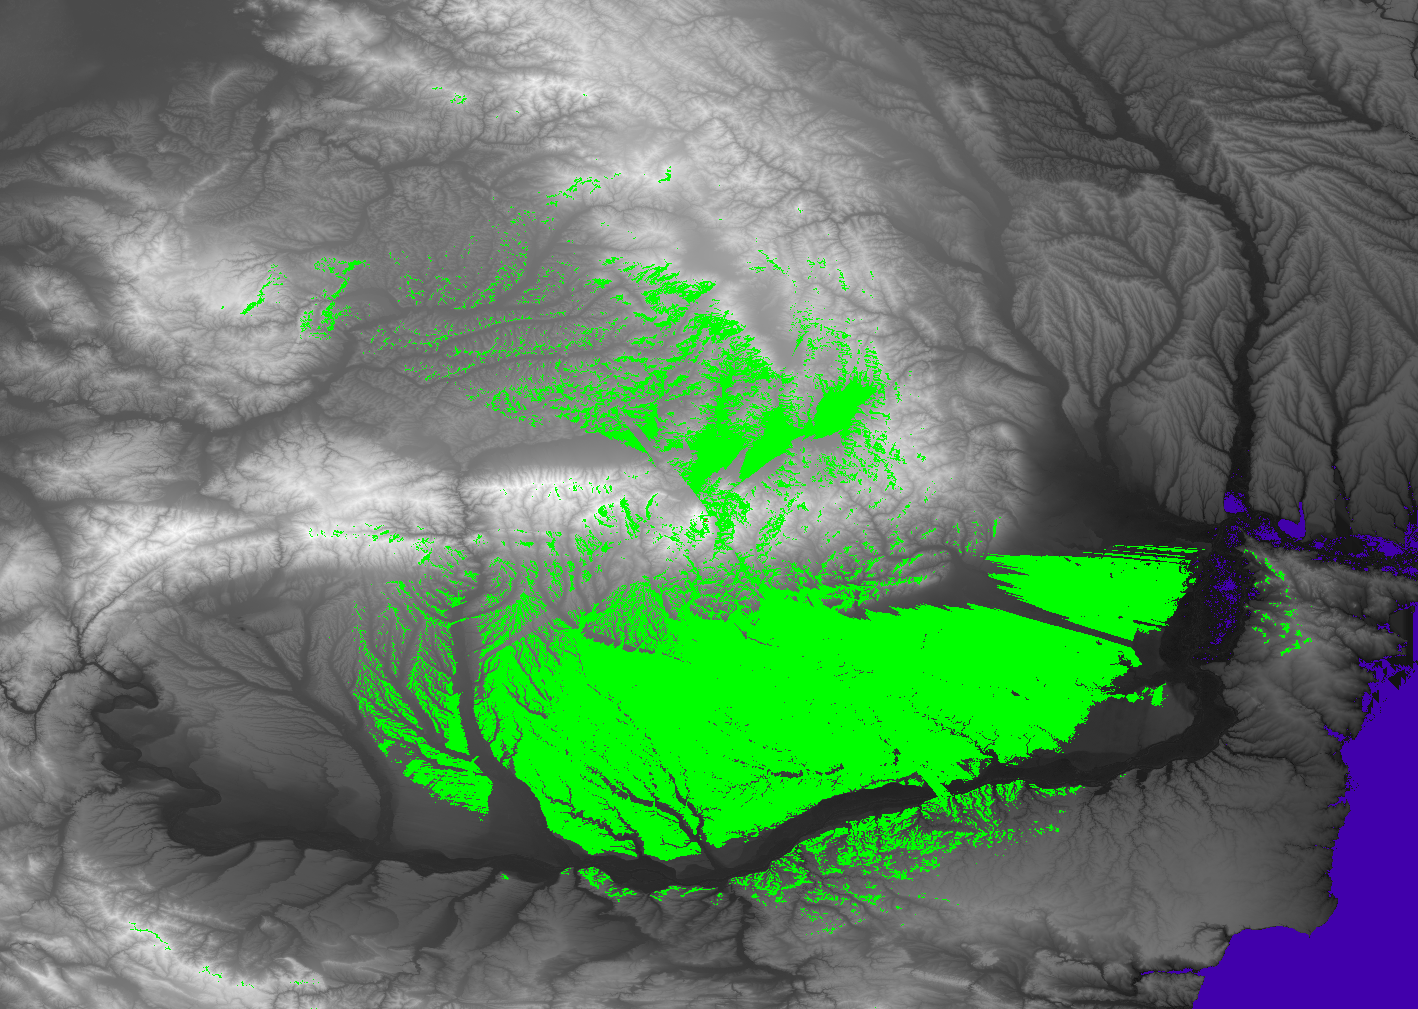
splat -t tx1.qth -c 10 -metric -d /path/to/sdf -o test.ppm
you will see the following result as shown below.

You may be interested in path loss map. For this you have to run the following command.
splat -t tx1.qth -L 10 -dbm -metric -d /path/to/sdf -o test.ppm
you will see the following result as shown below.

Similarly, additional analysis of receiving and transmitting can be done in SPLAT! . For more see the documentation of SPLAT!